
The average Dacorum home lost £16 in a year, at £454,770, while Hertfordshire rose 2.5%. Which property types fell, when the run stalled, and how the neighbours compare.
The average home in Dacorum was worth £454,770 in May 2026, which is £16 less than it was worth in May 2025. Not £16,000. Sixteen pounds. After three years in which Hemel Hempstead, Berkhamsted and Tring prices climbed, dipped and climbed again, the borough has arrived back almost exactly where it started, and it is the only district in this corner of Hertfordshire to have done so. (HM Land Registry, UK House Price Index, Dacorum, May 2026)
The figure comes from the UK House Price Index, the Land Registry’s monthly measure built from actual completed sales. One thing to hold on to before reading any further: UKHPI is a mean average, not a median. It adds up sale prices and divides, so a handful of very large sales in Berkhamsted or Little Gaddesden pull the borough number upwards in a way a median would not. It is the right measure for tracking change month by month, which is what this article does, and the wrong one for answering “what does a normal house here cost”.
Where the borough actually sits
| Measure (May 2026) | Average price | Change on a year earlier |
|---|---|---|
| All property types | £454,770 | −£16 (0.0%) |
| Detached | £920,588 | −£4,541 (−0.5%) |
| Semi-detached | £549,564 | +£6,159 (+1.1%) |
| Terraced | £420,690 | +£3,942 (+0.9%) |
| Flat or maisonette | £262,633 | −£5,855 (−2.2%) |
| First-time buyer | £367,682 | +£204 (+0.1%) |
All figures from the UK House Price Index for Dacorum, May 2026 against May 2025.
The headline nil change hides a split, and the split is the interesting part. The two cheaper ends of the market moved up: semi-detached homes gained £6,159 and terraces £3,942. The two ends that did not are the expensive one and the entry-level one. Detached homes lost £4,541, and flats lost £5,855, a 2.2% fall that is the sharpest of any property type in the borough. Because detached houses carry so much more weight in a mean, their small percentage slip cancelled out the gains beneath them almost exactly.
The month the run stalled
Dacorum was not flat all year. It peaked in November 2025 at £470,539, the highest monthly average the index has recorded for the borough since at least the start of 2022, when the figure was £420,066. Prices then fell for four of the next five months, and May 2026 sits £15,769 below that November high. (UK House Price Index, Dacorum, monthly series)
The annual rate tells the same story more plainly. It ran at 5.8% in November 2025, then 2.0% in January, 0.7% in February, 0.2% in March, and in April it went negative at −0.5%. That was the first year-on-year fall recorded for Dacorum since September 2024, a run of nineteen months.
There is a longer measure worth knowing. The index is set so that January 2023 equals 100 for each area. Dacorum’s reading in May 2026 is 101.4. Three years and four months on, the borough’s average home is 1.4% more expensive in cash terms, before any account is taken of what has happened to prices in the shops over the same period.
Every neighbour did better, bar one
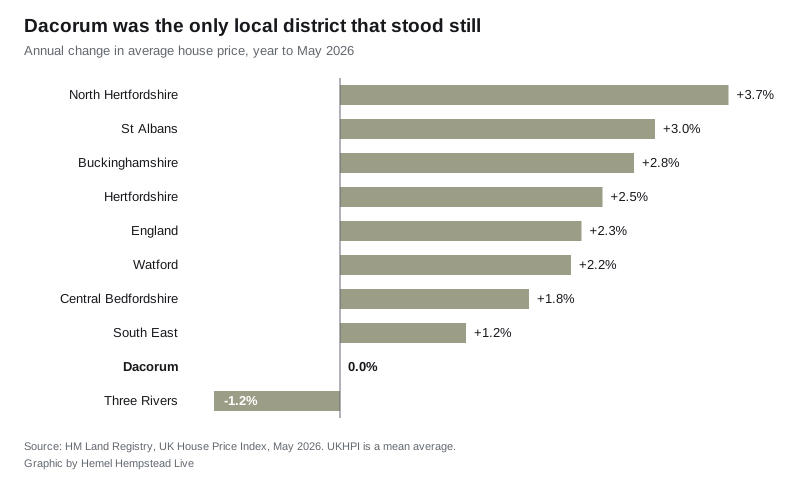
Set against the areas around it, Dacorum stands out for standing still. Hertfordshire as a county rose 2.5% to £467,251, and England rose 2.3% to £292,095. Next door in St Albans, the district Dacorum is due to merge with, prices rose 3.0% to £638,489. North Hertfordshire rose fastest of the group at 3.7%, to £416,735. Buckinghamshire, over the Tring boundary, rose 2.8% to £485,824, and is now the more expensive of the two. Watford rose 2.2% to £395,360 and Central Bedfordshire 1.8% to £354,320. (UK House Price Index, May 2026)
Only Three Rivers did worse, down 1.2% to £576,942. The pattern across the group is that the cheaper districts rose fastest and the expensive ones stalled, which fits what happened inside Dacorum, where the flats and the detached houses were the drag.
Two cautions on these numbers
The index is revised. Land Registry recalculates recent months as more completed sales are lodged, so the May figure may shift slightly in later releases, and a £16 gap is well inside the range in which that matters. Read the direction, not the decimal.
Sales volumes lag further behind than prices. The most recent month Land Registry has published a Dacorum sales count for is March 2026, when 118 homes changed hands. April and May counts are not out yet, so nobody can yet say whether the flat prices came with a thin or a busy market.
What it means for you
If you are selling, the year of easy asking-price rises has stopped in this borough, and the type of home you own matters more than it did. A semi or a terrace is worth about 1% more than a year ago. A detached house or a flat is worth slightly less. Pricing off a November 2025 comparable is pricing off the peak.
If you are buying, Dacorum has quietly become better value relative to its neighbours than it was a year ago, because St Albans, North Hertfordshire and Buckinghamshire all moved up while this borough did not. Flats are the one segment where the fall is large enough to notice, at 2.2%.
If you are a first-time buyer, the average first-time-buyer purchase in Dacorum was £367,682, which is £204 more than a year ago. In practical terms that is a standstill, and it is the first year in several where saving has not been a race against the price.
If the £454,770 looks nothing like your street, that is the mean at work. Our Hemel Hempstead house prices page works from individual recorded sales rather than the index, and lands nearer £441,240 for Hemel Hempstead itself with Berkhamsted far above it. The two are not contradicting each other: one is a borough-wide mean including every Berkhamsted and Little Gaddesden sale, the other is a town-level figure from the sales themselves.
What happens next to these numbers will be shaped in part by how much building the borough does. The Local Plan inspectors’ findings on Dacorum’s housing target, including the 1,400 homes proposed east of Tring, are covered on our Hemel Hempstead planning page.
The next UKHPI release, covering June 2026, is due from Land Registry in September.
Have your say